-
Teamwork Analytics
-
-
- Target Specific Team Owners by Country with Information
- Reminder about Team Guests
- New Public Teams without Guests
- Single Owner Reminder with Channel ID
- Public Teams Reminder with Channel ID
- Target Specific Team Members by AD attributes
- Teams Activity Reminder with Channel ID
- New Public Teams without Guests
-
-
- Summary
- Activity by Country and Modality
- Active User Counts
- Active User Percentages
- Active User Percentages All Bands
- Month on Month
- Device Usage
- Device Usage Details
- Avg Use Per User Per Day by Country
- Relative User Activity
- Users and Attributes
- Custom AD Attributes
- Data Freshness Detail
- Daily Active Users
- Weekly Active Users
- Monthly Active Users Percentage
- Relative Daily Active Users
- Relative Weekly Active Users
- Relative Monthly Active Users
- Activity Counts Daily
- Activity Counts Weekly
- Activity Counts Monthly
- Per User Activity Daily
- Per User Activity Weekly
- Per User Activity Monthly
- Show Remaining Articles (10) Collapse Articles
-
- Team Stats
- Teams Distribution
- User Collab Activity
- Collab Activity (Averages)
- Collab Activity (Totals)
- User Mention Activity
- Team Files
- Per Team Profile
- Guest Distribution
- Guest Details
- Users and Attributes
- Threads Country Interaction
- Replying Country Interaction
- Threads Department Interaction
- Replying Department Interaction
- Active Teams Files and Chat
- Teams Channel Chat Activity
- Data Freshness Detail
- Show Remaining Articles (3) Collapse Articles
-
- Meeting Trends
- Meeting Detail
- Meetings Per User Trends
- Meeting Join Stats
- Meeting Join Dashboard
- Meeting Joins by Country
- Meeting Join Country Detail
- Meeting Joins by User
- Calls Per User Trends
- Call Stats
- Calls Dashboard
- Calls by Country
- Calls Country Detail
- Calls by Users (All)
- Calls by Users (Last 14 days)
- Interaction Overview (Last 14 days)
- Call Interactions (Last 14 days)
- Meeting Interactions (Last 14 days)
- Show Remaining Articles (3) Collapse Articles
-
-
-
- Querying the RAW JSON Call Records Files
- Data Issues with Microsoft Teams user activity Get user detail Endpoint
- Check Data Freshness from Microsoft Reporting API
- Get Call Record from Graph
- Calls and Meetings Database Schema
- Deploy a Calls & Meetings Automation scenario (CAT)
- CAT Installs – Customer Monitoring
- Configure Task Scheduler for Automation
- SQL Backups
- CAT Configuration Notes
- Data Nuances
- DeadLetterManager
- Calls and Meetings Aggregate Table Calculations
- Anonymisation of Selected Users PII Data
- Excluding teams from file scan
- Configure Custom User Attributes – Usage and Governance
- Configure Data Retention – Usage and Governance CAT
- Data Collection Configuration (Scan)
- Show Remaining Articles (3) Collapse Articles
-
- Call Queue and Auto Attendant data
- Collecting Logs – Usage and Governance
- Comparing Teamwork Analytics to other solutions
- Data Collection Explained Usage and Governance
- Data Dictionary and Reporting Capabilities Usage and Governance
- Decommission
- Determining current data collection state
- FAQ Usage and Governance
- Files / Drive Items
- Messages
- Monitoring and Maintenance Tasks Usage and Governance CAT
- Relative User Activity Thresholds
- Security Details
- Usage and Governance Data Collected and Capabilities
- Usage and Governance Dependencies
- Calls & Meetings Definitions
- Database Version
- Show Remaining Articles (2) Collapse Articles
-
-
Teams Audit
-
Teams Chat Assist
-
OneConsultation
KPI Clusters
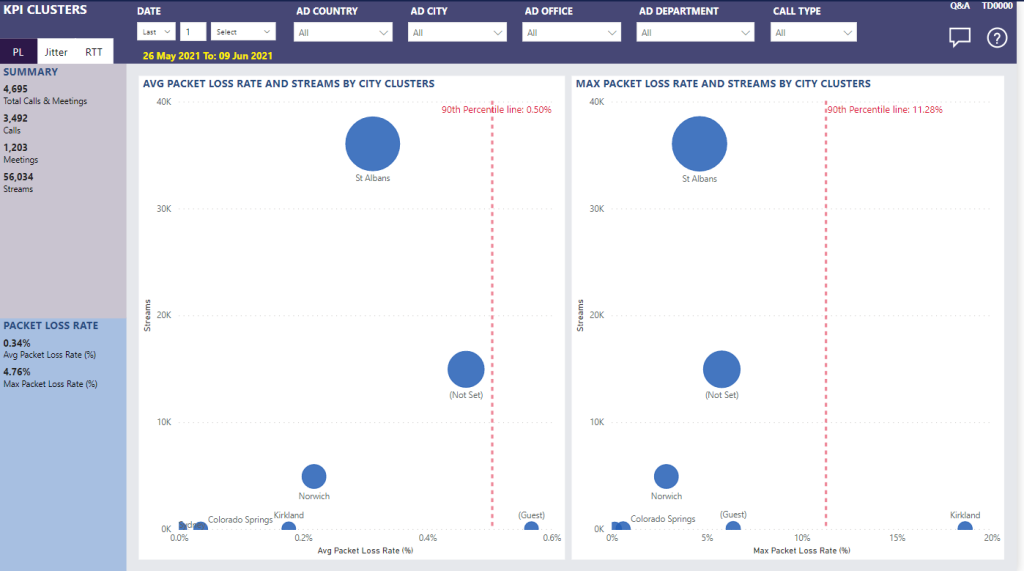
Summary
Clusters let you quickly find the network KPIs relative to a stream count and the similarity of the KPI into a similar grouping by city to quickly determine locational factors and similar traits impacting your organisation.
A 90% percentile line gives a majority association of the KPI to the city and a clear indication of the most impacted top 10% city.
Learn more about network KPIs and the effect they have on calls.
Use the date, Active Directory and Call Type slicers at the top of the report to limit to a particular area of interest. Further advanced filtering can be carried out using the Filter pane on the right hand side.
This report tells me
Summary counts
- Total calls, meetings and streams
Summary of each KPI
- Average and maximum packet loss, jitter and round trip
KPIs and Streams by City Clusters
- Average and maximum packet loss, jitter and round trip rates clustered, relative to stream count and packet loss grouped by city
- Average and maximum packet loss, jitter and round trip rates line indication to the majority as a 90th Percentile line
Tips
Use the KPI tabs in the top left corner to switch the view between Packet Loss, Jitter and Round Trip Time.