-
Teamwork Analytics
-
-
- Target Specific Team Owners by Country with Information
- Reminder about Team Guests
- New Public Teams without Guests
- Single Owner Reminder with Channel ID
- Public Teams Reminder with Channel ID
- Target Specific Team Members by AD attributes
- Teams Activity Reminder with Channel ID
- New Public Teams without Guests
-
-
- Summary
- Activity by Country and Modality
- Active User Counts
- Active User Percentages
- Active User Percentages All Bands
- Month on Month
- Device Usage
- Device Usage Details
- Avg Use Per User Per Day by Country
- Relative User Activity
- Users and Attributes
- Custom AD Attributes
- Data Freshness Detail
- Daily Active Users
- Weekly Active Users
- Monthly Active Users Percentage
- Relative Daily Active Users
- Relative Weekly Active Users
- Relative Monthly Active Users
- Activity Counts Daily
- Activity Counts Weekly
- Activity Counts Monthly
- Per User Activity Daily
- Per User Activity Weekly
- Per User Activity Monthly
- Show Remaining Articles (10) Collapse Articles
-
- Team Stats
- Teams Distribution
- User Collab Activity
- Collab Activity (Averages)
- Collab Activity (Totals)
- User Mention Activity
- Team Files
- Per Team Profile
- Guest Distribution
- Guest Details
- Users and Attributes
- Threads Country Interaction
- Replying Country Interaction
- Threads Department Interaction
- Replying Department Interaction
- Active Teams Files and Chat
- Teams Channel Chat Activity
- Data Freshness Detail
- Show Remaining Articles (3) Collapse Articles
-
- Meeting Trends
- Meeting Detail
- Meetings Per User Trends
- Meeting Join Stats
- Meeting Join Dashboard
- Meeting Joins by Country
- Meeting Join Country Detail
- Meeting Joins by User
- Calls Per User Trends
- Call Stats
- Calls Dashboard
- Calls by Country
- Calls Country Detail
- Calls by Users (All)
- Calls by Users (Last 14 days)
- Interaction Overview (Last 14 days)
- Call Interactions (Last 14 days)
- Meeting Interactions (Last 14 days)
- Show Remaining Articles (3) Collapse Articles
-
-
-
- Querying the RAW JSON Call Records Files
- Data Issues with Microsoft Teams user activity Get user detail Endpoint
- Check Data Freshness from Microsoft Reporting API
- Get Call Record from Graph
- Calls and Meetings Database Schema
- Deploy a Calls & Meetings Automation scenario (CAT)
- CAT Installs – Customer Monitoring
- Configure Task Scheduler for Automation
- SQL Backups
- CAT Configuration Notes
- Data Nuances
- DeadLetterManager
- Calls and Meetings Aggregate Table Calculations
- Anonymisation of Selected Users PII Data
- Excluding teams from file scan
- Configure Custom User Attributes – Usage and Governance
- Configure Data Retention – Usage and Governance CAT
- Data Collection Configuration (Scan)
- Show Remaining Articles (3) Collapse Articles
-
- Call Queue and Auto Attendant data
- Collecting Logs – Usage and Governance
- Comparing Teamwork Analytics to other solutions
- Data Collection Explained Usage and Governance
- Data Dictionary and Reporting Capabilities Usage and Governance
- Decommission
- Determining current data collection state
- FAQ Usage and Governance
- Files / Drive Items
- Messages
- Monitoring and Maintenance Tasks Usage and Governance CAT
- Relative User Activity Thresholds
- Security Details
- Usage and Governance Data Collected and Capabilities
- Usage and Governance Dependencies
- Calls & Meetings Definitions
- Database Version
- Show Remaining Articles (2) Collapse Articles
-
-
Teams Audit
-
Teams Chat Assist
-
OneConsultation
Location Quality
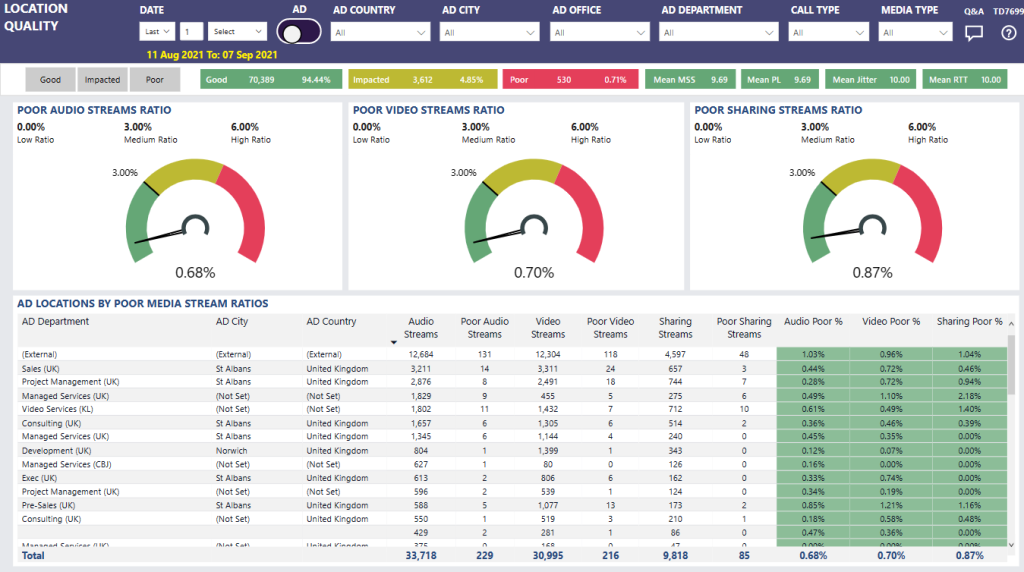
Summary
I can see the poor streams ratio for audio, video and sharing streams in a simple gauge visual format.
Microsoft recommend 3% as a starting target for poor streams, and this will be in the green range of each gauge. 3-6% will be in amber, over 6% into red.
The lower pane shows for each AD department / city / country the total and poor streams for each media type. The last three columns for poor % are colour coded allowing easy identification of areas where performance drops below 3% poor. Using the AD / Building switch this can be changed to Building name / city / country instead.
Use the date, Active Directory and Call Type slicers at the top of the report to limit to a particular area of interest. Further advanced filtering can be done using the Filter pane on the right hand side.
This report tells me
Top pane
- Good classified streams – number of streams and percentage of total
- Impacted classified streams – number of streams and percentage of total
- Poor classified streams – number of streams and percentage of total
- Mean MSS (Modality Stream Score) – mean average of stream scores
- Mean PL (Modality Stream Score, only considering packet loss) – mean average of stream scores
- Mean Jitter (Modality Stream Score, only considering jitter) – mean average of stream scores
- Mean RTT (Modality Stream Score, only considering round-trip times) – mean average of stream scores
Poor Audio Streams Ratio
- Percentage of audio streams classified as poor
Poor Video Streams Ratio
- Percentage of video streams classified as poor
Poor Sharing Streams Ratio
- Percentage of sharing streams classified as poor
AD locations by poor media stream ratios
- Active Directory Department
- Active Directory City
- Active Directory Country
- Count of total audio streams
- Count of poor audio streams
- Count of total video streams
- Count of poor video streams
- Count of total sharing streams
- Count of poor sharing streams
- Audio Poor %
- Video Poor %
- Sharing Poor %
Tips
This report can also be used to find the largest groups of users by number of audio, video or sharing streams. For example, to find the department using most video. click on the Video Streams column header to sort by this value.