Calls and Meetings Architecture – Data Flows
This document provides an overview of how data flows from Microsoft Graph into Teamwork Analytics Calls and Meetings for reporting, automation and alerting.
The solution can be deployed as SaaS managed by Modality in Azure, SaaS managed by Modality in customer Azure tenant or customer self-deployed in their Azure tenant (CAT).
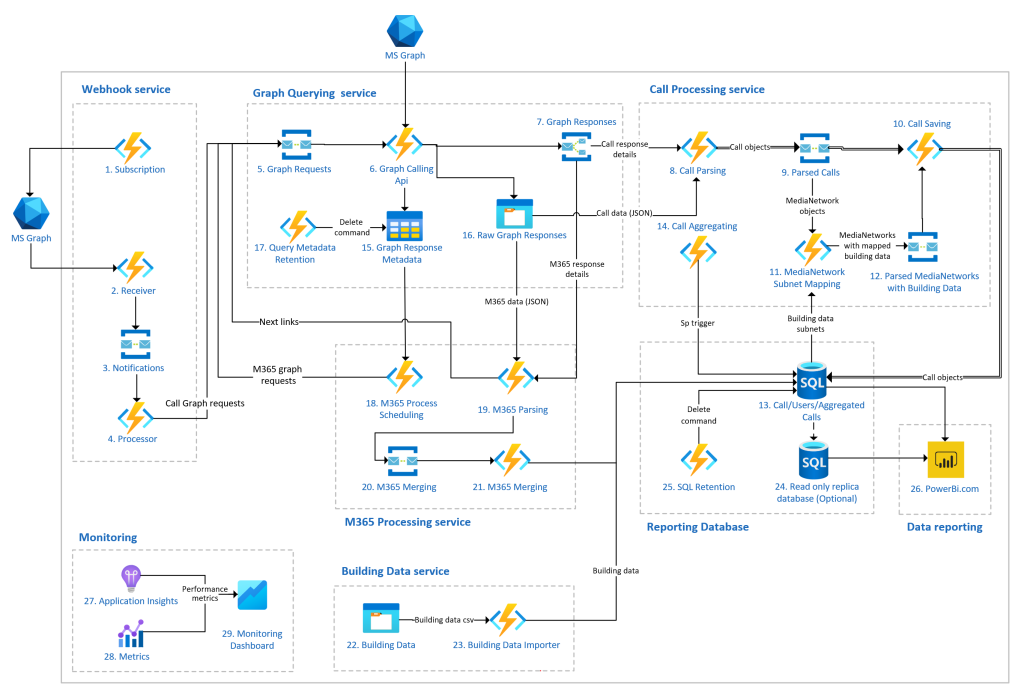
1. Data Ingest – Microsoft Graph
Calls and Meetings Architecture is collecting information from the following Graph Endpoints:
- Call records – webhook API providing usage and diagnostic information about Teams calls and meetings
- Microsoft Graph for User Attributes – to map users to Active Directory attributes such as department or role
The data is collected from Graph via granting read-only access to the relevant graph endpoints. Active Directory information is collected once a day and the latest attributes are held for all users. Call and Meeting data is webhook based, meaning Microsoft’s API will tell us when to collect the data and it is constantly being collected after calls and meetings are completed.
In addition, Calls and Meetings consume subnet to building mapping location in the same format as Call Quality Dashboard CSV, which is manually uploaded to TWA’s Azure storage account, using a container called building-data
2. Data Processing – Azure functions
Once data is collected from the API’s and subnet CSV, it is processed via a number of Azure functions that complete the following
- Copy raw graph responses
- Collect and store stream data
- Process data to add Modality scoring, subnet mapping and store aggregate data
- Optionally anonymise some or all records based on Active Directory Attribute mapping
- Apply any data retention policies
- Log generation for reporting – application insights
3. Stored Data – Azure SQL
Call, Meeting and user data is kept in the following Azure SQL stores:
- Store RAW graph response for any future troubleshooting
- Store optimised subset of data for every stream of every call/meeting – for deep-dive reporting
- Optimised aggregate tables or call and meeting data for longer-term storage and reporting
- Application Insights for logging and solution performance reporting
These are used for reporting, automation and alerting. Retention of each of these can be defined by the customer
4. Reporting – Power BI
Reporting is via Microsoft Power BI. Power BI reads data from Azure SQL on a regular schedule, up to 8 times a data for Power BI Pro and more for Power BI premium. Data is cached in the Power BI service, meaning reports are fast to render and filter.
Power BI reports are installed on customer tenants and given read-only access to the Azure SQL. Here are the full details of all reports available.
5. Automation – Teams adaptive cards to end-users – Azure Bot Framework
Automation refers to sending end users automated adaptive card messages directly in Microsoft Teams. These are triggered by regular queries of the stored data. A SQL query is created to trigger based on agreed attributes, such as device usage or call performance, then messages are sent to the relevant target users.
Adaptive cards can be designed to meet specific customer requirements, including graphics, charts and icons.
Messages are sent via Azure Bot Framework.
6. Alerting – Email, Channel Messages or Tickets in ITSM platform – Azure Logic Apps
Alerting can be used to notify IT of issues that need resolution. Teamwork Analytics can configure alerts to your exact requirements leveraging the power of Azure Logic Apps. Example alerts:
- Mapped Subnet is showing X % more packet loss than normal
- In-office wireless users are using 2.4 GHz or are on the wrong wireless network
- Non-certified device usage is over the threshold
- Room systems are experiencing quality issues
These require Azure logic apps that can be configured by customers or Modality.