-
Teamwork Analytics
-
-
- Target Specific Team Owners by Country with Information
- Reminder about Team Guests
- New Public Teams without Guests
- Single Owner Reminder with Channel ID
- Public Teams Reminder with Channel ID
- Target Specific Team Members by AD attributes
- Teams Activity Reminder with Channel ID
- New Public Teams without Guests
-
-
- Summary
- Activity by Country and Modality
- Active User Counts
- Active User Percentages
- Active User Percentages All Bands
- Month on Month
- Device Usage
- Device Usage Details
- Avg Use Per User Per Day by Country
- Relative User Activity
- Users and Attributes
- Custom AD Attributes
- Data Freshness Detail
- Daily Active Users
- Weekly Active Users
- Monthly Active Users Percentage
- Relative Daily Active Users
- Relative Weekly Active Users
- Relative Monthly Active Users
- Activity Counts Daily
- Activity Counts Weekly
- Activity Counts Monthly
- Per User Activity Daily
- Per User Activity Weekly
- Per User Activity Monthly
- Show Remaining Articles (10) Collapse Articles
-
- Team Stats
- Teams Distribution
- User Collab Activity
- Collab Activity (Averages)
- Collab Activity (Totals)
- User Mention Activity
- Team Files
- Per Team Profile
- Guest Distribution
- Guest Details
- Users and Attributes
- Threads Country Interaction
- Replying Country Interaction
- Threads Department Interaction
- Replying Department Interaction
- Active Teams Files and Chat
- Teams Channel Chat Activity
- Data Freshness Detail
- Show Remaining Articles (3) Collapse Articles
-
- Meeting Trends
- Meeting Detail
- Meetings Per User Trends
- Meeting Join Stats
- Meeting Join Dashboard
- Meeting Joins by Country
- Meeting Join Country Detail
- Meeting Joins by User
- Calls Per User Trends
- Call Stats
- Calls Dashboard
- Calls by Country
- Calls Country Detail
- Calls by Users (All)
- Calls by Users (Last 14 days)
- Interaction Overview (Last 14 days)
- Call Interactions (Last 14 days)
- Meeting Interactions (Last 14 days)
- Show Remaining Articles (3) Collapse Articles
-
-
-
- Querying the RAW JSON Call Records Files
- Data Issues with Microsoft Teams user activity Get user detail Endpoint
- Check Data Freshness from Microsoft Reporting API
- Get Call Record from Graph
- Calls and Meetings Database Schema
- Deploy a Calls & Meetings Automation scenario (CAT)
- CAT Installs – Customer Monitoring
- Configure Task Scheduler for Automation
- SQL Backups
- CAT Configuration Notes
- Data Nuances
- DeadLetterManager
- Calls and Meetings Aggregate Table Calculations
- Anonymisation of Selected Users PII Data
- Excluding teams from file scan
- Configure Custom User Attributes – Usage and Governance
- Configure Data Retention – Usage and Governance CAT
- Data Collection Configuration (Scan)
- Show Remaining Articles (3) Collapse Articles
-
- Call Queue and Auto Attendant data
- Collecting Logs – Usage and Governance
- Comparing Teamwork Analytics to other solutions
- Data Collection Explained Usage and Governance
- Data Dictionary and Reporting Capabilities Usage and Governance
- Decommission
- Determining current data collection state
- FAQ Usage and Governance
- Files / Drive Items
- Messages
- Monitoring and Maintenance Tasks Usage and Governance CAT
- Relative User Activity Thresholds
- Security Details
- Usage and Governance Data Collected and Capabilities
- Usage and Governance Dependencies
- Calls & Meetings Definitions
- Database Version
- Show Remaining Articles (2) Collapse Articles
-
-
Teams Audit
-
Teams Chat Assist
-
OneConsultation
Add Charts to Automation Adaptive Cards with QuickChart
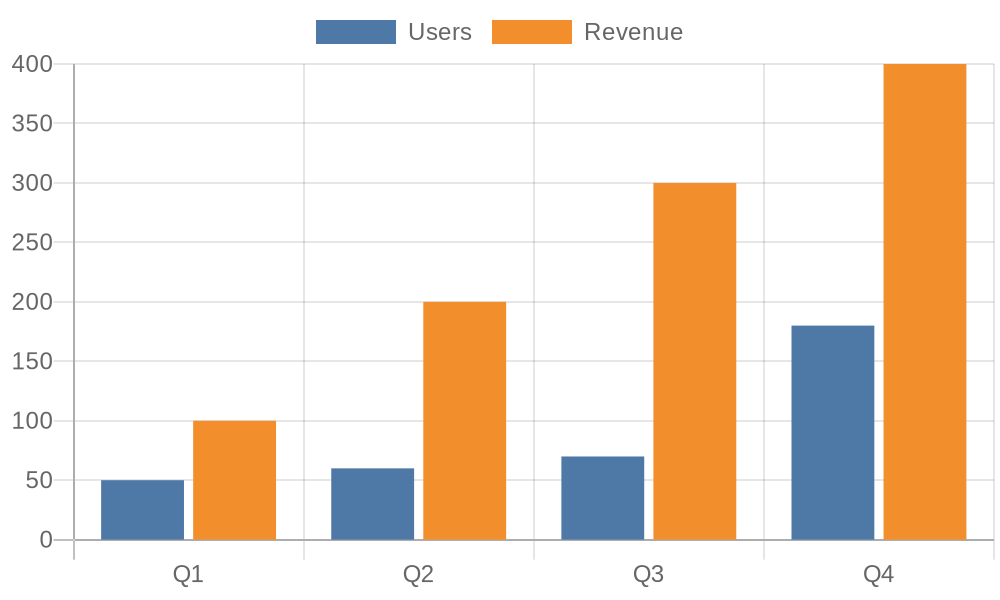
QuickChart is an API for programmatically rendering charts and graphs. This allows us to embed charts in our Teamwork Automation messages. To make a chart all you need to do to consume it is construct a url that looks like the following:
https://quickchart.io/chart?c={type:'bar',data:{labels:['Q1','Q2','Q3','Q4'], datasets:[{label:'Users',data:[50,60,70,180]},{label:'Revenue',data:[100,200,300,400]}]}}
Which yields the following image:
Adding to Teamwork Automation
To add a QuickChart to a Teamwork Automation template, simply paste the URL into an image element, e.g.:
{ "type": "Image", "url": "https://quickchart.io/chart?c={type:'bar',data:{labels:['Q1'], datasets:[{label:'Users',data:[50]}]}}", "size": "large" }
This can be tested in the Adaptive Card Designer.
To use data from the TWA notification service, simply paste the variables into the URL e.g.:
Variable: ${RowsWithAdditionalProperties[0].Value.MeetingsVsCallsPercentage}
Variable inside a URL: https://quickchart.io/chart?c={type:'bar',data:{labels:['Q1'], datasets:[{label:'Users',data:[${RowsWithAdditionalProperties[0].Value.MeetingsVsCallsPercentage}]}]}}
Further reading
At QuickChart’s homepage there are interactive editors for constructing URLs, a gallery of examples, and extensive documentation.